Create Reports with Data Explorer
When you use Data Explorer to create reports you don't need a robust understanding of SQL. Navigate the relationships between our data tables, and search and use data objects on reports using a simple, intuitive interface. Each data object is presented in a way that clearly shows its relationship to joined data.
You must first enable the Data Explorer feature before you can perform these steps.
To create a report using Data Explorer:
-
Click the arrow to expand one of the following areas to find the items you want to add to your report.
Note: It may help to consider how the item you are searching for relates to other data in the object/table you select. For example, if you are exploring the Class table, looking for student information, consider if the Class table would have many student records? If Yes, you search in Other Items That Are Linked to the Object/Table. If No, search in Fields.
- Fields in the Object/Table: Browse in
Fields
for items with Many to One relationships with the selected Object/Table, if what you are looking for has only a single instance in the selected Object/Table. For example, if you are looking for information on a class that an individual student is taking in the
Class Student table, you know that there are many student records, but
only a single class in the whole table.
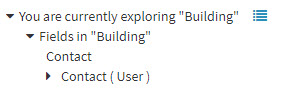
Note: The Fields folder contains sub-folders that indicate a join, which when clicked, allows access to the data in the joined table. Exploring these fields is useful when a field in the first table is numeric, but you want readable text on your report. In the screen shot below, Contact (User), indicates that Contact is the field name in the initial Building table, and User is the name of the table being joined. When you click on one of these sub-folders, you initiate the join. Essentially, you ask the Reporting Tool to join the User table to see more details about your Building's Contact.
- Other Items That Are Linked to the Object/Table: Browse in
Other Items That Are Linked for items with One to Many relationships with the selected Object/Table, in situations where what you are looking for has multiple instances in the selected Object/Table. For example, if you are looking in the
Class table for student information, you know there will be
many student records, so you search in the
Other Items That Are Linked folders.
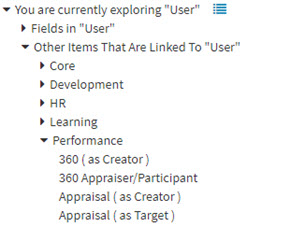
Note: The Other Items That Are Linked to folder contains some items that when clicked will create a relation between the table you are exploring and the secondary table. In this example below, if you click Appraisal (as Creator), the Appraisal table opens in the Your Data pane, with a relation chain between the User table and the Appraisal table.
- Fields in the Object/Table: Browse in
Fields
for items with Many to One relationships with the selected Object/Table, if what you are looking for has only a single instance in the selected Object/Table. For example, if you are looking for information on a class that an individual student is taking in the
Class Student table, you know that there are many student records, but
only a single class in the whole table.
-
In the
Field Actions area, if desired, modify the name of the column, by typing a new name in the
Column Title field. To add the field as a column on the report, click
Add this field to my report.
This adds the field to your Cart at the bottom of the screen, below the Report pane. Columns can be removed from the report by clicking the Remove icon
 .
.
-
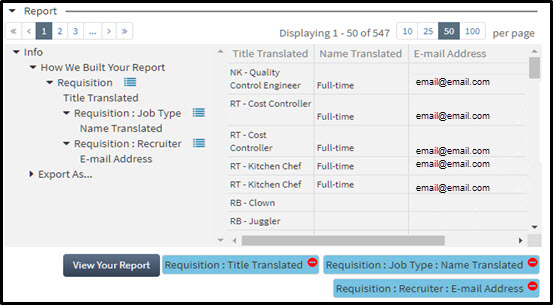
If there is at least one column in your Cart, the Cart will contain a
View Your Report button. Click
View Your Report to build the report in the Report pane, using the selected columns.
The first column in the Report pane, titled Info, displays all included data as a tree.